Cross-Session Analytics
Sentiero ships a cross-session analytics suite alongside the replay dashboard. It aggregates behavior across many recorded sessions (overview stats, segments, JS errors, click heatmaps, scroll depth, and form funnels), plus a CSV/JSON export.
Mounting
All analytics routes live under /analytics* and are owned by Sentiero::Web::AnalyticsApp. There is a single mount point:
- DashboardApp delegation (default).
DashboardAppdelegates any/analytics(/...)request toAnalyticsAppafter its own auth check. Mount the dashboard and you get analytics at the same base path for free. - Direct mount. A Roda app can mount it explicitly with the
r.sentiero_analyticshelper.
Both apps subclass Sentiero::Web::BaseApp, so analytics shares the dashboard’s auth/CSRF/asset machinery via BaseApp. AnalyticsApp re-reads PATH_INFO/SCRIPT_NAME from the Rack env so the base path is preserved regardless of where it is mounted.
Compute-on-read model
There are no analytics tables, rollups, or fact-extraction jobs. Every page queries the configured store at request time and aggregates in Ruby through the store’s each_session_events (built from list_sessions + get_session + get_events), so analytics works identically across every backend (Memory, File, SQLite, Redis, Rails AR).
The scan is bounded by config.analytics_max_scan_sessions (default 5000). Analyzers read at most that many session summaries, newest first.
When a scan hits the cap, the page renders a truncation banner (was_truncated) so the numbers are understood as a sample of the most recent sessions rather than an all-time total.
Authentication
Every analytics route requires auth, sharing the dashboard’s auth check. An unauthenticated request is rejected before any handler runs: when config.basic_auth is set the response is 401 with a WWW-Authenticate header, otherwise (an auth_callback returning falsy) it is 403. If no auth is configured the dashboard/analytics are not safe to expose; see Authentication.
Pages
Overview: /analytics
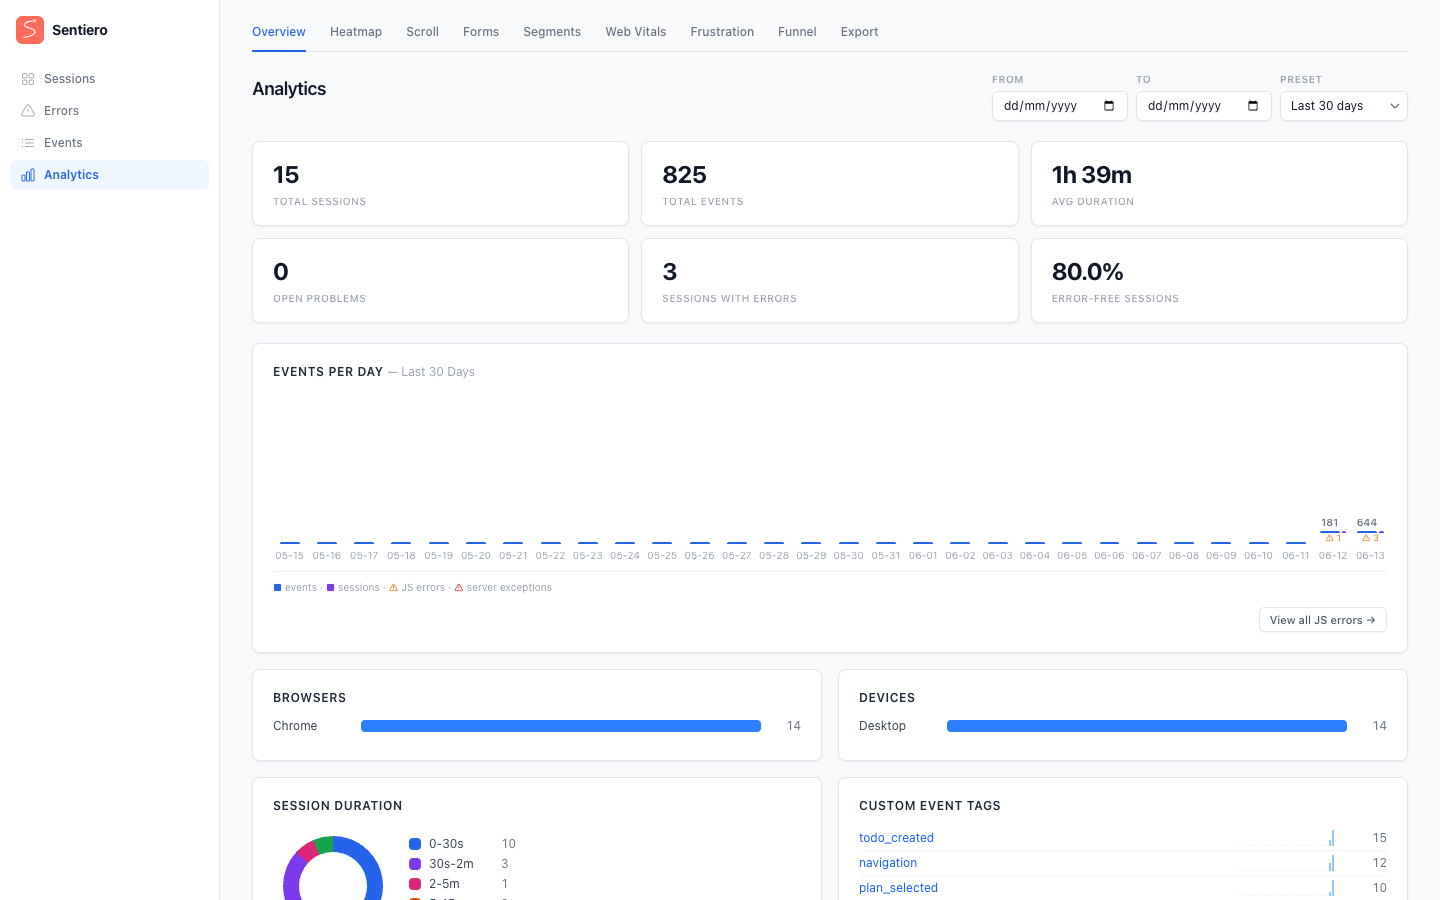
The landing page. StatsAggregator computes totals and distributions over a trailing window: total sessions, total events, average session duration, browser/device distributions, top entry pages, top referrers, session duration buckets, custom event tag counts with per-day sparkline series, and an events-per-day time series (with optional server-exception overlay). A range query parameter selects the window; only 14, 30, and 90 days are accepted (anything else falls back to the 30-day default).
Segments: /analytics/segments
A filtered listing of individual sessions, like the dashboard’s session index. Segmenter scans up to the cap, applies the filters in Ruby, then paginates the survivors. Filters:
- Browser: one of
Chrome,Safari,Firefox,Edge,Opera,Other(derived from the recorded user-agent). - Device: one of
Desktop,Mobile,Tablet. - URL pattern: substring match on the recorded URL, or a glob pattern using
*(any sequence) and?(any single character), matched case-insensitively viaFile.fnmatch. Patterns containing*or?are treated as globs; all others fall back to substring search. - Metadata key/value: match a custom metadata field, with a match mode of
exactorcontains. - Has errors: only sessions flagged with errors.
- Min/Max duration: entered in whole seconds (converted to ms internally).
Dropdown values are validated against closed sets; anything off-list is treated as “no filter”. Free-text inputs are capped at 256 characters and the page number is clamped, so a hostile query string can’t blow up the scan.
Errors (no analytics route)
Errors are not an analytics page. AnalyticsApp has no /analytics/errors route; such a request 404s. Client-side JS errors and server-side exceptions both surface under the unified /issues route in DashboardApp, which groups them by fingerprint with occurrence counts, first/last-seen timestamps, and links to session replays. Use /issues for server exceptions and /issues?source=client for client-side JS errors. See Error Tracking.
Heatmap: /analytics/heatmap
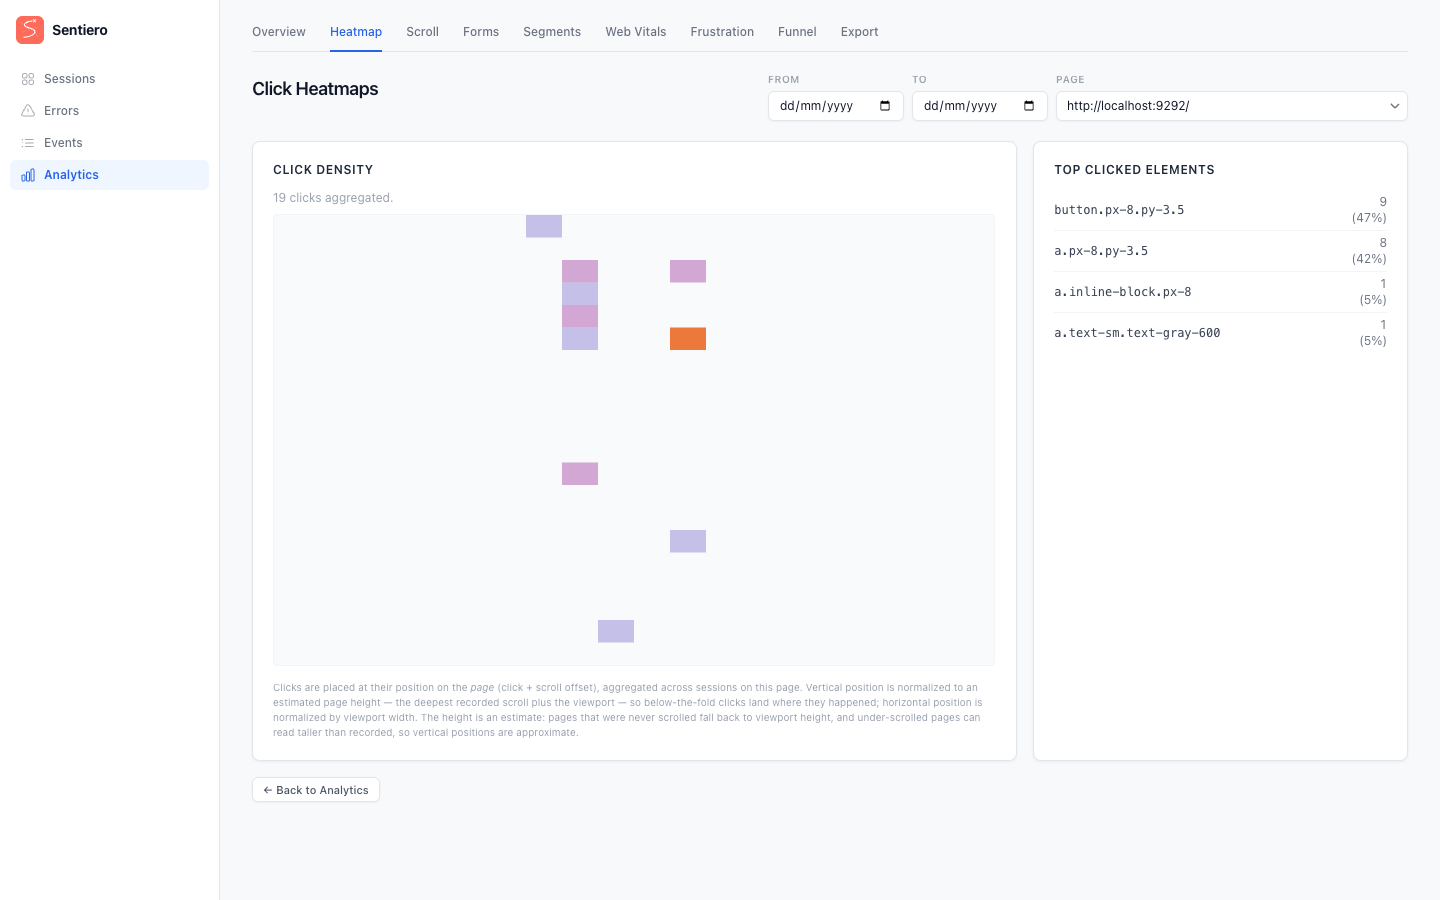
HeatmapAnalyzer aggregates click positions into a fixed 20×20 grid (GRID_SIZE = 20; each bucket spans 5% of the normalized axis) for a single selected URL. Clicks come from rrweb incremental events (type: 3, source: 2, the SOURCE_MOUSE_INTERACTION source) with subtype 2 (MOUSE_CLICK); scroll events with the same type but source: 3 are used only to derive page-relative y coordinates. The page offers a picker of all recorded page URLs (based on Meta-href entries in the event stream, not filtered to only URLs with clicks); the grid itself is fetched from a read-only JSON endpoint, /analytics/heatmap.json, which returns the bucketed clicks, top clicked elements, total clicks, and a representative window for rendering the underlying page.
Scroll: /analytics/scroll
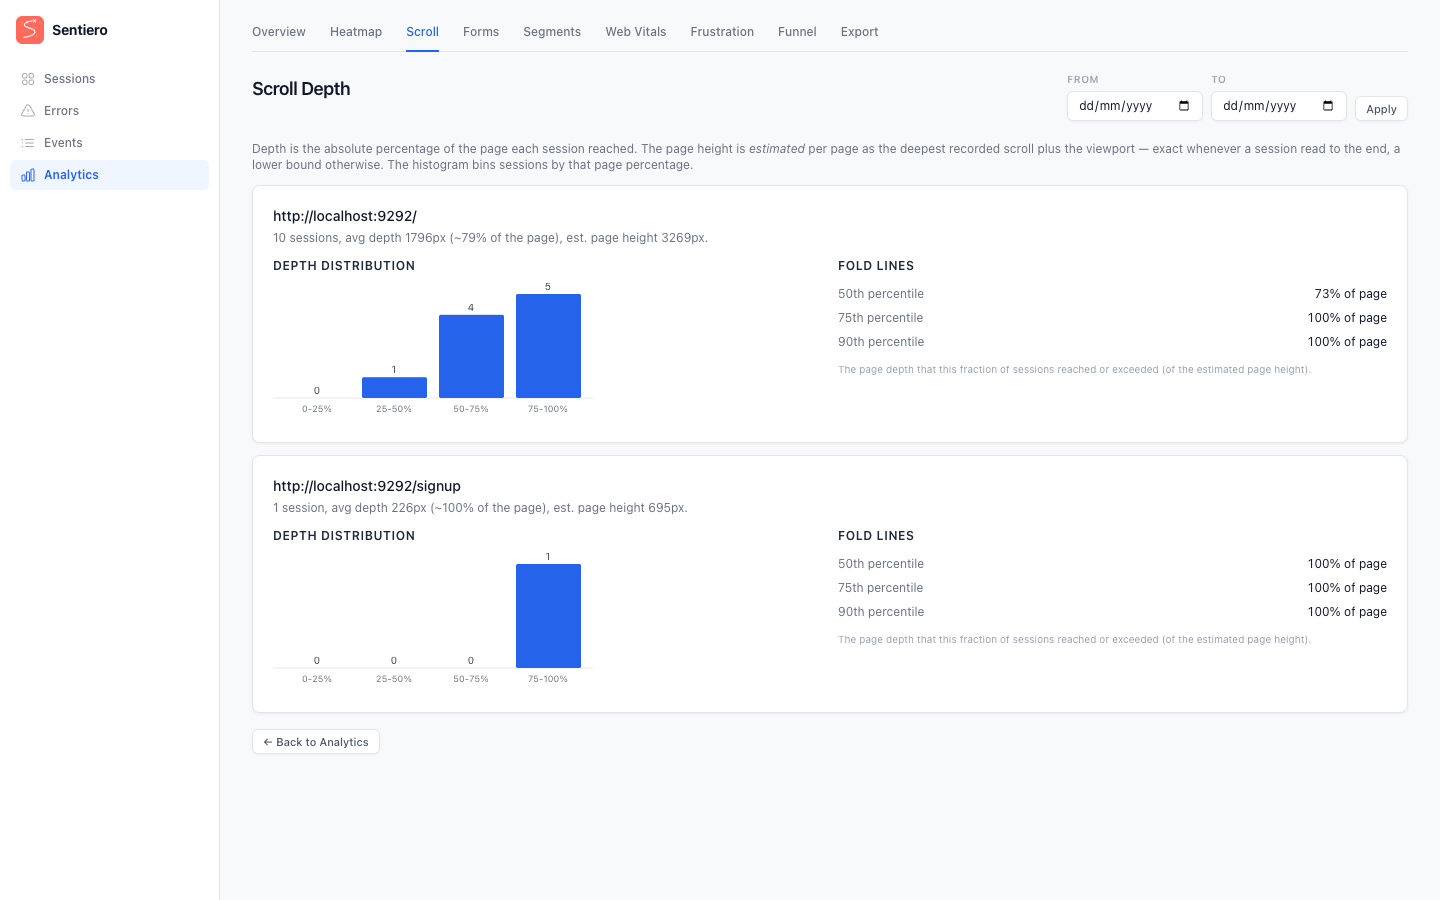
ScrollDepthAnalyzer reports, per URL, how far down the page users scrolled. Depth is computed as the absolute page percentage the bottom of the session’s viewport reached: the deepest scroll offset plus the viewport height, divided by an estimated page height (the deepest scroll + viewport bottom any session reached on that URL, which is exact when someone scrolled to the bottom and a lower bound otherwise). Depths are clamped at 100%: the deepest session defines the estimate and therefore reads exactly 100. The result is bucketed into four bands: 0–25, 25–50, 50–75, and 75–100 percent. The analyzer also computes fold lines (p50/p75/p90: the page depth that 50%, 75%, and 90% of sessions reached) and average depth metrics (avg_depth_px, avg_depth_pct). All of this comes from rrweb scroll events (type: 3, source 3).
Forms: /analytics/forms
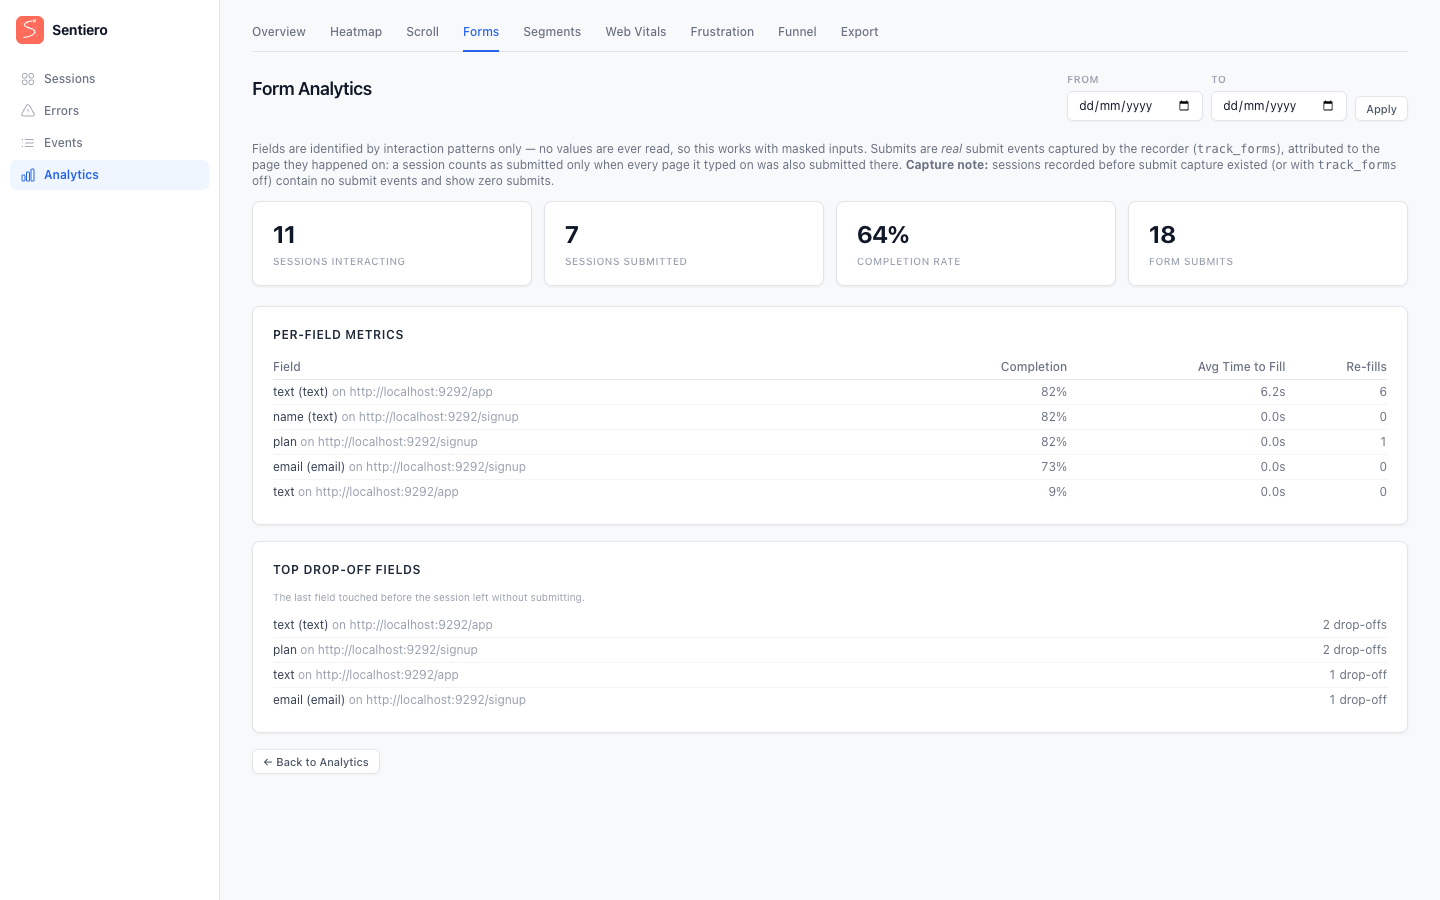
FormAnalyzer reads rrweb input events (type: 3, source 5) for field interactions and __form_submit custom events for submits: how many sessions interacted with a form, how many submitted, the completion rate, the raw submit count, per-field fill counts, and likely drop-off fields.
Submits are real: with config.track_forms enabled, the recorder installs a capture-phase document submit listener and emits a __form_submit custom event carrying the form’s non-PII identity (its name/id attributes, never field values) plus the page URL. Attribution is per page (split on rrweb Meta-href boundaries): a page’s form interactions count as completed only when a __form_submit landed on that same page at or after the first input, and a session counts as completed only when every page it typed on was submitted. A genuine submit on a later page therefore can’t mask an earlier abandonment.
Capture-version note: sessions recorded before __form_submit capture existed (or with track_forms off) contain no submit events and report zero submits. The analyzer deliberately does not fall back to counting navigations. The old “navigation after input = submit” heuristic counted abandoners as converters.
Web Vitals: /analytics/vitals
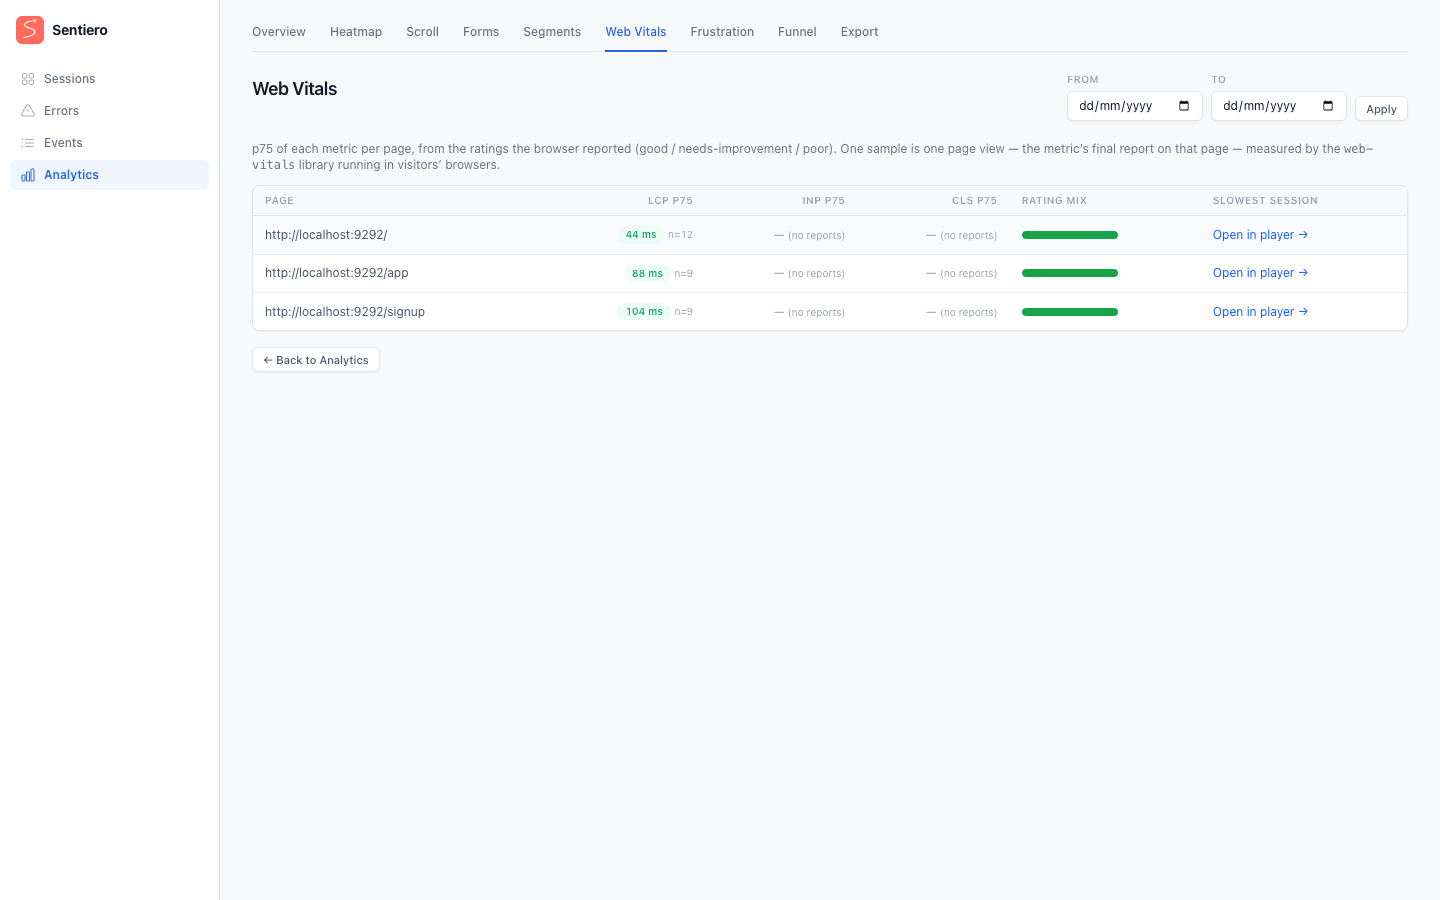
With config.capture_web_vitals enabled, the recorder loads the web-vitals library and emits each metric’s final value as a __perf custom event. WebVitalsAnalyzer reports the p75 of LCP, INP, and CLS per page (one sample is one page view: the metric’s final report on that page, measured in the visitor’s own browser), alongside the good / needs-improvement / poor rating mix the browser reported and a link to the slowest session’s replay.
Funnel: /analytics/funnel
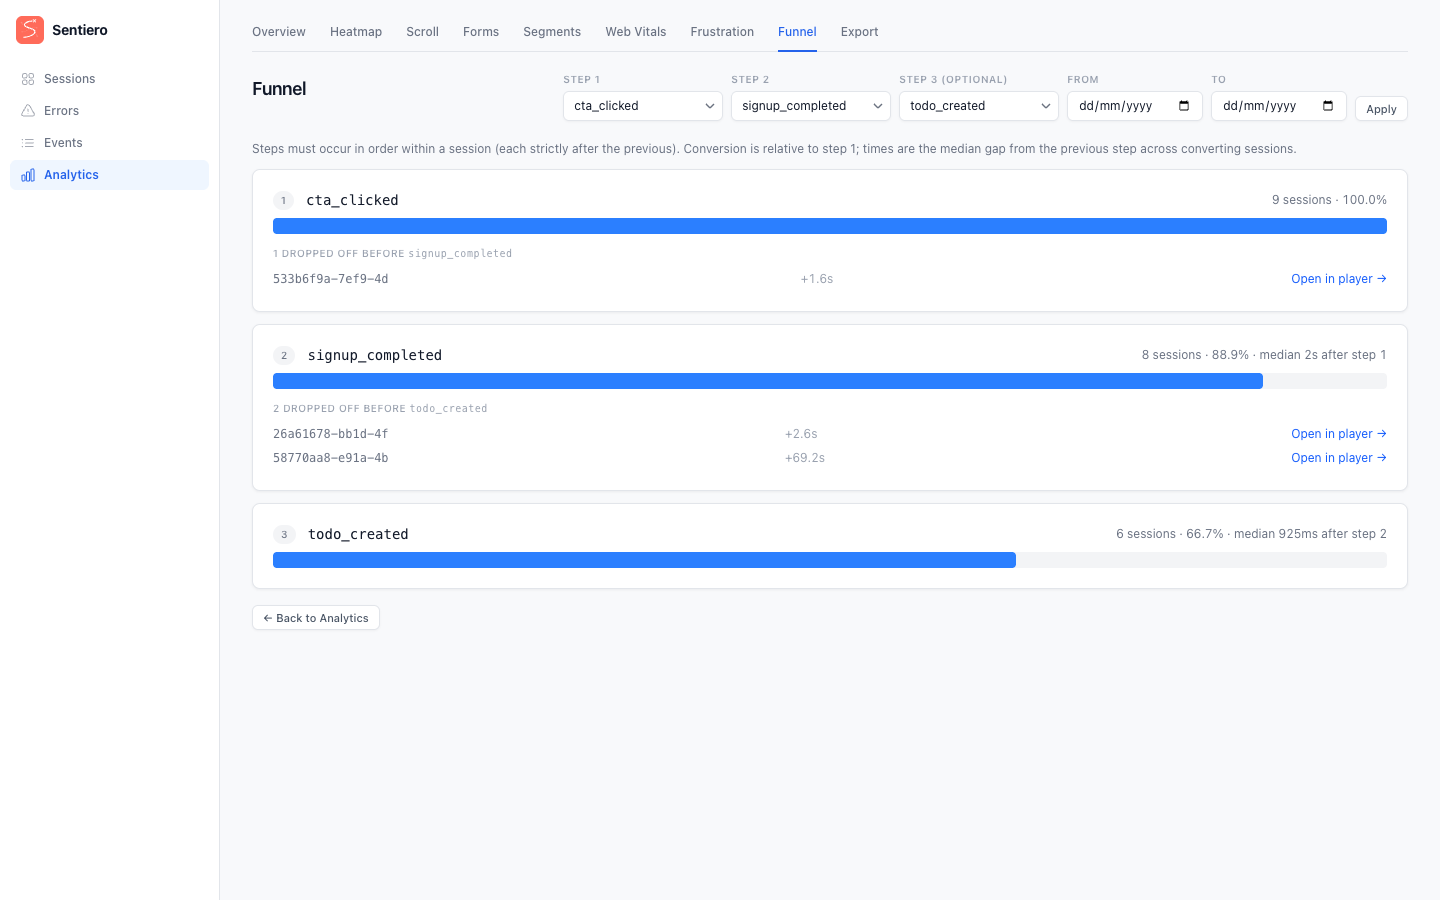
Pick up to three custom-event tags as ordered steps; FunnelAnalyzer reports how many sessions reached each step, the conversion percentage (relative to step 1), and the median time gap from the previous step across converting sessions. Steps must occur in order within a single session (each strictly after the previous). Every step links the converting (and dropped) sessions straight to their replay, and the step dropdowns are populated from the custom-event tag vocabulary seen in the scanned window.
Frustration: /analytics/frustration
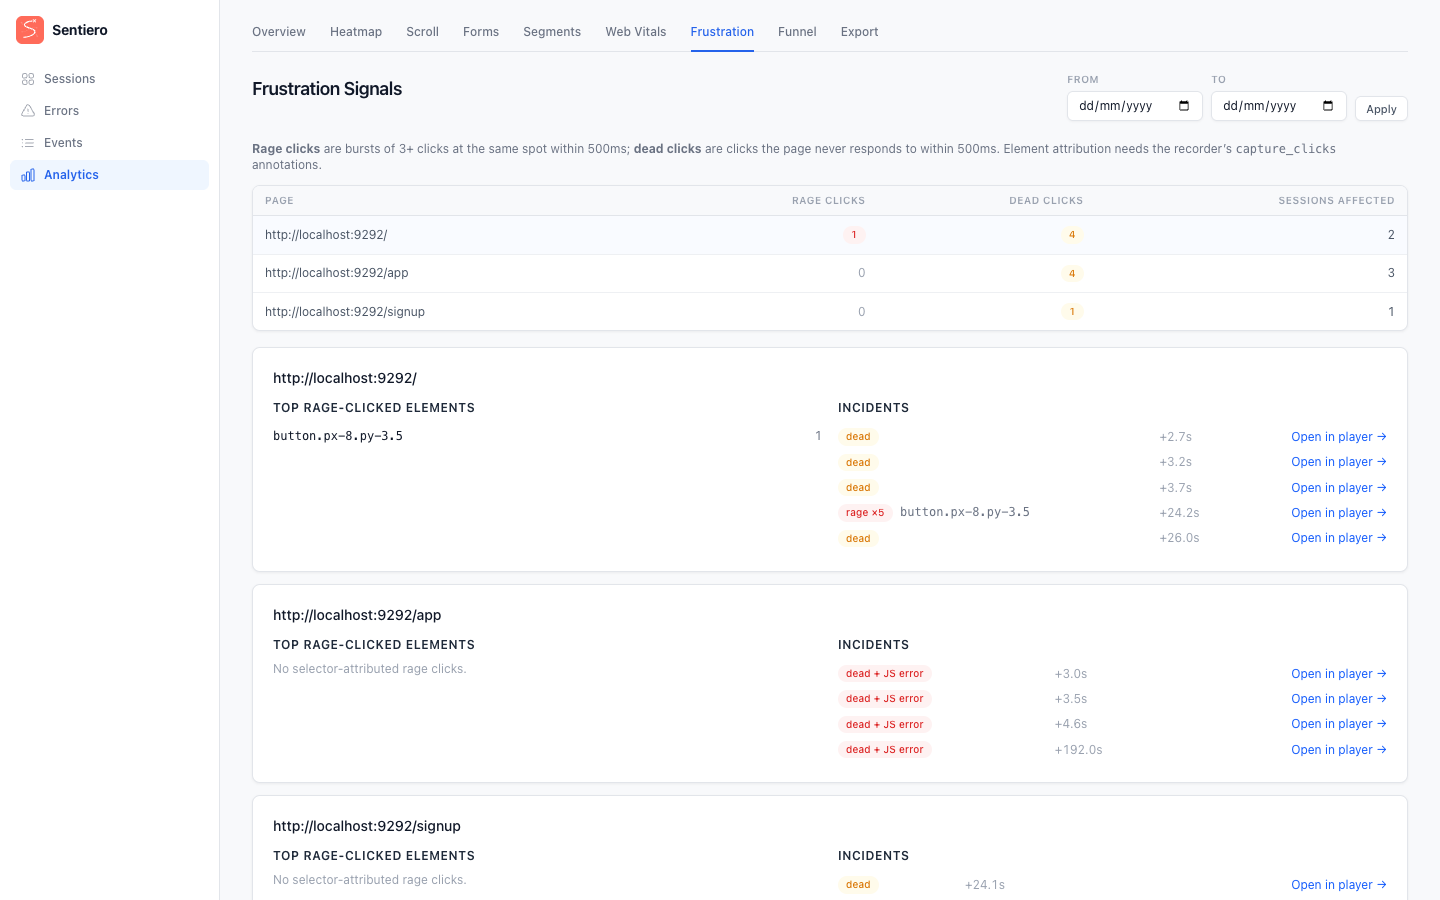
FrustrationAnalyzer surfaces two friction signals per page: rage clicks (bursts of 3+ clicks at the same spot within 500ms) and dead clicks (a click the page never responds to within 500ms: no DOM mutation, navigation, or scroll follows). Each incident links to that moment in the replay and is annotated when a JS error coincided (dead + JS error). Element attribution (the CSS selector of the clicked element) requires config.capture_clicks, which annotates clicks with a selector via __click events.
Engagement: /analytics/engagement
EngagementAnalyzer scores each session by struggle signals (rage clicks, dead clicks, JS errors, rapid navigations) and returns a ranked, replay-linkable list alongside a five-bin score distribution. Higher scores mean more friction. Because it surfaces individual sessions it is audited like Segments.
Conversions: /analytics/conversions
ConversionAnalyzer reports conversion rate by acquisition dimension (entry page, referrer host, and UTM parameters) for one selected custom-event tag. The tag dropdown is populated from the same scanned event vocabulary as the Funnel page; internal tags (__-prefixed, "error") are excluded.
Page report: /analytics/page
PageReportAnalyzer is a per-URL drill-down that composes every available metric for a single selected page URL: scroll depth, clicks, vitals, frustration signals, and form interactions. With no URL selected the expensive scan is skipped entirely and the page renders a URL picker populated from HeatmapAnalyzer.recorded_urls.
Export: /analytics/export (CSV / JSON)
The export index lists the available datasets (sessions, errors, browser_events, problems, server_events, stats, heatmap, scroll, forms, web_vitals), each computed on read through the analyzers above. A download is a POST to /analytics/export/{dataset}.{csv|json} and is CSRF-guarded with the same token discipline as the dashboard: a GET returns 405, a missing/invalid token returns 403, an unknown dataset returns 404.
CSV output is formula-injection-guarded: a cell beginning with a formula trigger (=, +, -, @, or a leading tab/CR) is prefixed with a single quote so spreadsheets treat it as text, and cells are RFC 4180 quoted.
Auditing
When config.audit_log is set, sensitive analytics actions are logged: the segments listing (list_sessions), each export (export, with the dataset), and each share download (share, with the session ID). See Privacy & Masking for the audit-log payload.